
Date: 05/21/2026
TABLE OF CONTENTS
Preface
I wrote this piece as my final project for the class 21A.406: Anthro-Engineering: From Lab to Land - Infrastructures of Climate Justice in the Pacific North West. I took it in Spring 2026. This was my final semester as an undergraduate. I will be graduating!
This piece is a centralized place where I got to convey a lot of my feelings surrounding the state of public transportation and car-centrism in the United States. I hope you enjoy reading it :).
At some point, I will write about how exactly cars are an engineering tragedy, coming from the lens of a mechanical engineer. Stay tuned!
Rekindling the North-South Station Link
This design intervention explores implementing cleaner and more just infrastructure for marginalized communities in the Boston area as a form of reparations for the segregationist origins of many interstate projects, as well as the continued injustice of car-dependent infrastructure. Specifically, over the course of three to five years, this intervention will involve removing at least two lanes of the I-93 interstate in the O’Neill Jr. Tunnel in order to make space for a North-South Station rail link, which will make transportation more accessible and affordable for many Bostonians.
This intervention centers on the core of what it means to be human. We are social creatures that thrive in community and civility. This was discussed at-length in the book “In the Spirit of Right and Respectful Relations.” This book proposes sharing the violent historical relationships between European settlers and Original peoples as a way to build empathy and understanding within non-Indigenous people, inspiring them to stand with the Salmon nations in the fight to protect their home, their lifeways, and the relations between the human and non-human residents of the Salish Sea [3]. This intervention similarly attempts to design for the collective well-being of all those residing in Boston, in particular centering marginalized communities. Bringing to light the vast social and climate injustices of car-centrism may garner empathy and support for those most adversely impacted by infrastructure injustice, as it is instinctually human to care for others in need. This may in turn galvanize people to collectively fight for more just infrastructure.
Researching the true extent of segregation by urban design reveals a telling story for the moral imperative of interventions that reduce car-dependency. Half of America’s current highway systems have their origins in President Dwight D. Eisenhower’s Federal-Aid Highway Act of 1956. This project was rooted in racism: said to eliminate “urban blight,” code for low-income, minority communities [4]. Systematically, highways and roadways have been designed to filter traffic away from wealthy neighborhoods into low-income ones; keeping more affluent areas clean and safe while bringing pollution and pedestrian fatalities to poorer ones.
Boston is no stranger to segregationist urban design. Since the early days of expressway construction in the 1950s, Boston city planners have intentionally directed commuter traffic away from predominantly white suburbs. In 1959 this led to the construction of the Central Artery, a large elevated part of I-93 that ran straight through central Boston. With its construction came the demolition of primarily working-class, racially-integrated central neighborhoods, such as in West End, Chinatown, and Downtown. The project ultimately displaced 20,000 residents [5]. Additionally, the construction led to the bulldozing of several historic Boston squares: Adams Square, Scollay Square, and Haymarket Square. The Central Artery was quite dangerous, with an accident rate four times the national average. It was also incredibly prone to congestion, with city planners projecting that by 2010 there would be a total of 16 hours of traffic jams on the route every day [6].
This extreme congestion was projected to cost drivers $500 million annually in lost revenue from wasted time. To address this, Boston proposed a solution: the “Big Dig,” arguably one of the most daunting and complex highway construction projects in US history. From 1991 to 2007 [7], the Big Dig was built, directing the expressway into a 1.5-mile underground tunnel and leaving a Greenway up top. Originally, the project included plans to add a Massachusetts Bay Transportation Authority (MBTA) link between the North and South Station, but this feature was eventually scrapped. The city claimed this was to prevent additional incurred costs as well as to widen the lanes. The original budget for the project was $2.6 billion, but after extensive delays and mismanagement it ended up costing a whopping $24.3 billion [8]. This makes it hard to believe that extra costs would have been a big issue, as the project already went over budget by such a large amount.
The city purports that this project was an astounding “success,” as total vehicle hours expended by Bostonians dropped 62% from 1995 to 2003 [6]. However, this figure only accounts for time savings while the Big Dig was underway; it is suspicious that they do not cite statistics outside the time span of the Big Dig. It is possible that temporary lower roadway capacity due to construction played a more significant role in lowering vehicle time expenditure than the widening of lanes. Let us look at more current figures. As of 2018, Boston was ranked the US’s most congested city, costing the average driver $2,205 from lost time and the city as a whole $4.1B in lost revenue per year [9]. This cost is far more than the $500 million projected back in the 1990s, even when accounting for inflation. This project ultimately exacerbated car traffic and cemented car-centrism in Boston, under the guise of improving the city landscape.
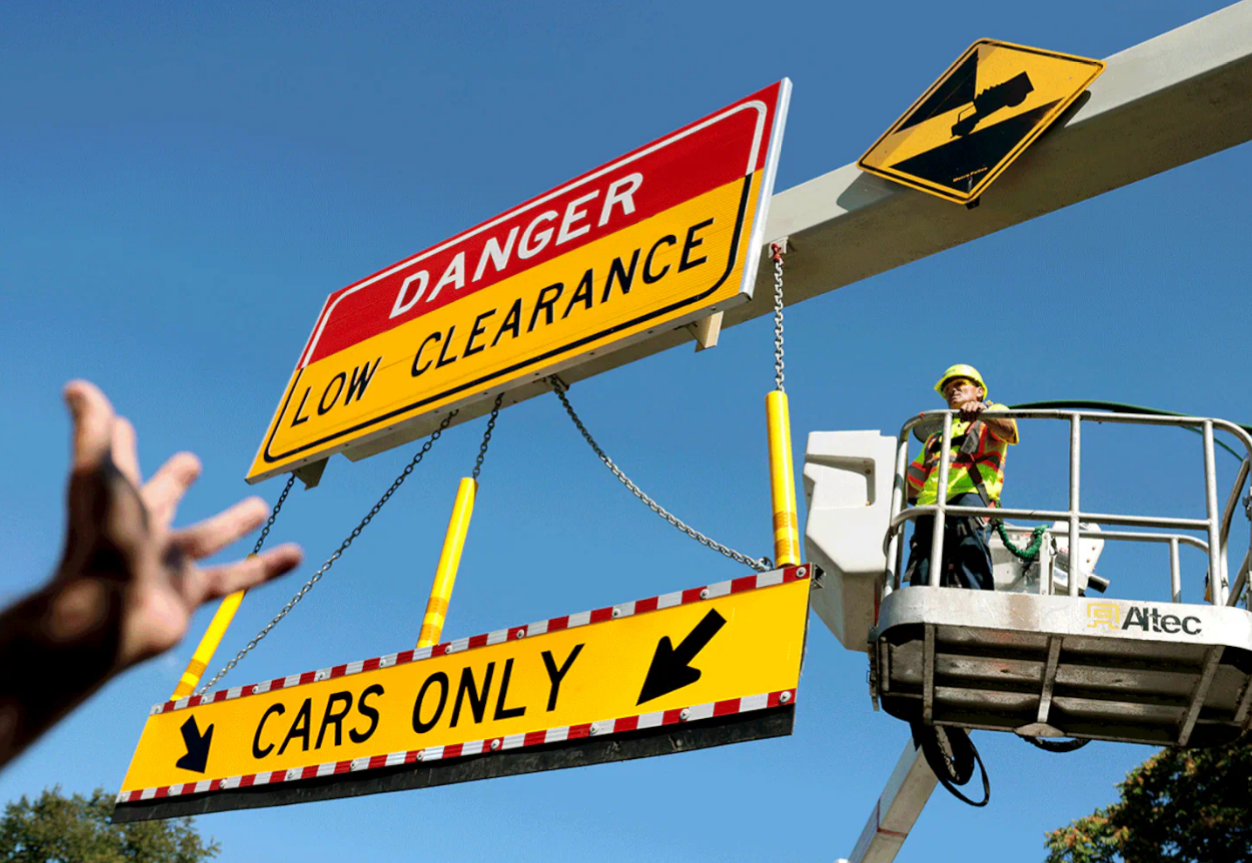
Another glossed-over tool of urban segregation is low clearance streets. They are a common sight, where certain streets only let through cars and no taller vehicles like buses [10]. This is a recurring tool of segregation, as low-income people, many of whom are immigrants and people of color (POC), often depend on buses as an affordable mode of transportation. These low clearance streets bar a significant portion of marginalized groups from parts of Boston because buses can not pass through these low clearance areas.
It is clear how pervasive segregationist urban design is here in Boston with car-centrism still prioritized. Cars themselves are also ecologically disastrous. In Massachusetts, transportation is the largest single source of greenhouse gas (GHG) emissions. As of 2022, it was responsible for 38% of statewide emissions, the vast majority of which come from on-road vehicles [12]. In addition to greenhouse gases which contribute to global warming, cars also emit other harmful chemicals into their surroundings. The pollution alone is killing Bostonians. Toxic emissions from onroad vehicles are responsible for 342 premature deaths in Greater Boston each year [13]. Do not be mistaken that electrical vehicles (EVs) will be the solution. A significant portion of microplastics that we breathe in come from worn-down car, bus, and truck tires. A team of German researchers found that of all the microplastics sampled from the air (in Germany) for their study, 65% originated from cars and trucks [14]. Heavier vehicles wear down tires faster. EVs are on average 10-15% heavier than their internal-combustion counterparts [15], which suggests that their increased presence will only exacerbate microplastic pollution from cars. By design, much of Boston’s traffic is directed through low-income, POC communities, who then face the most adverse effects of car pollution.
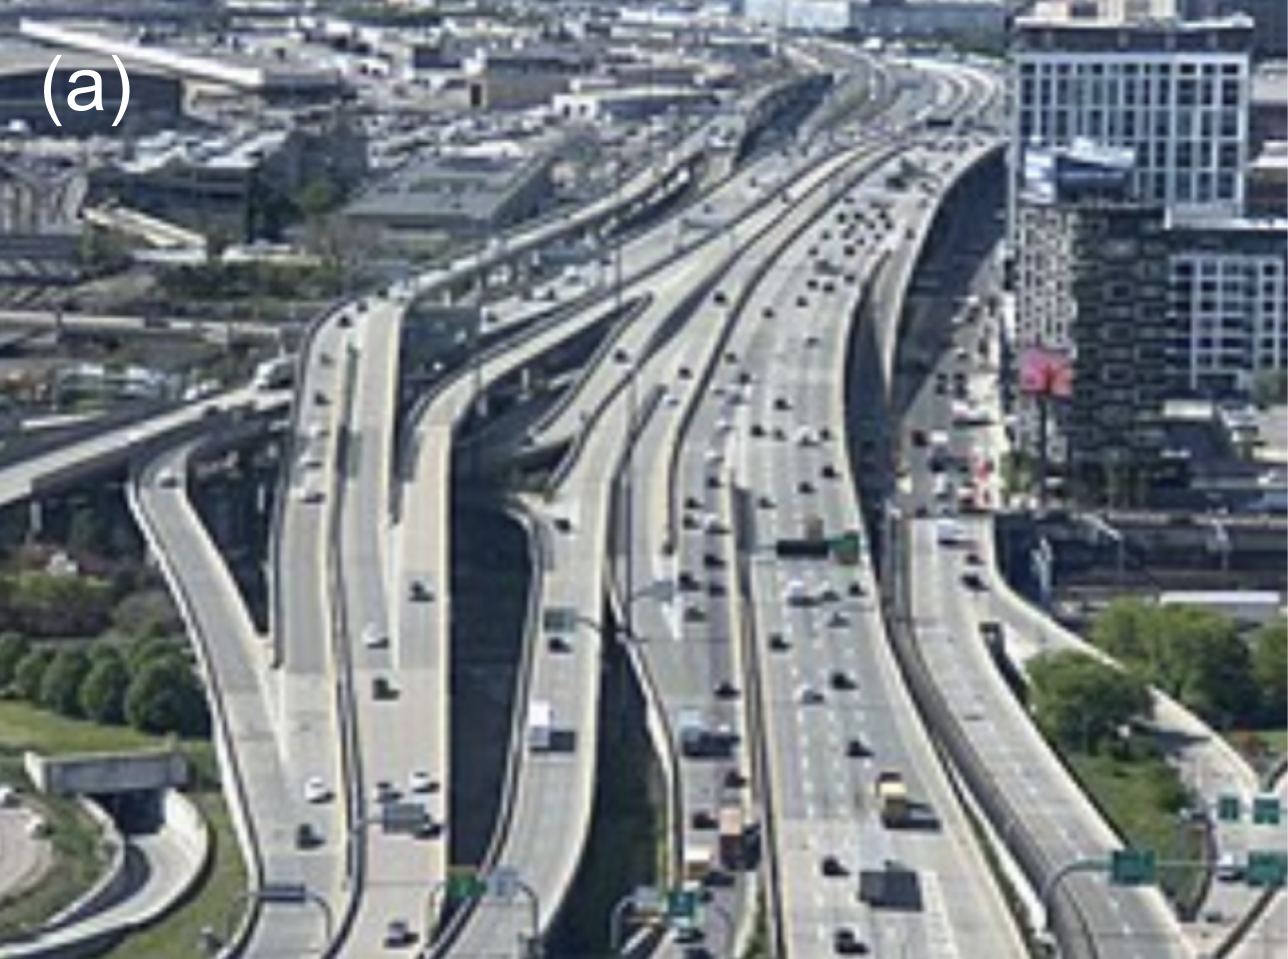
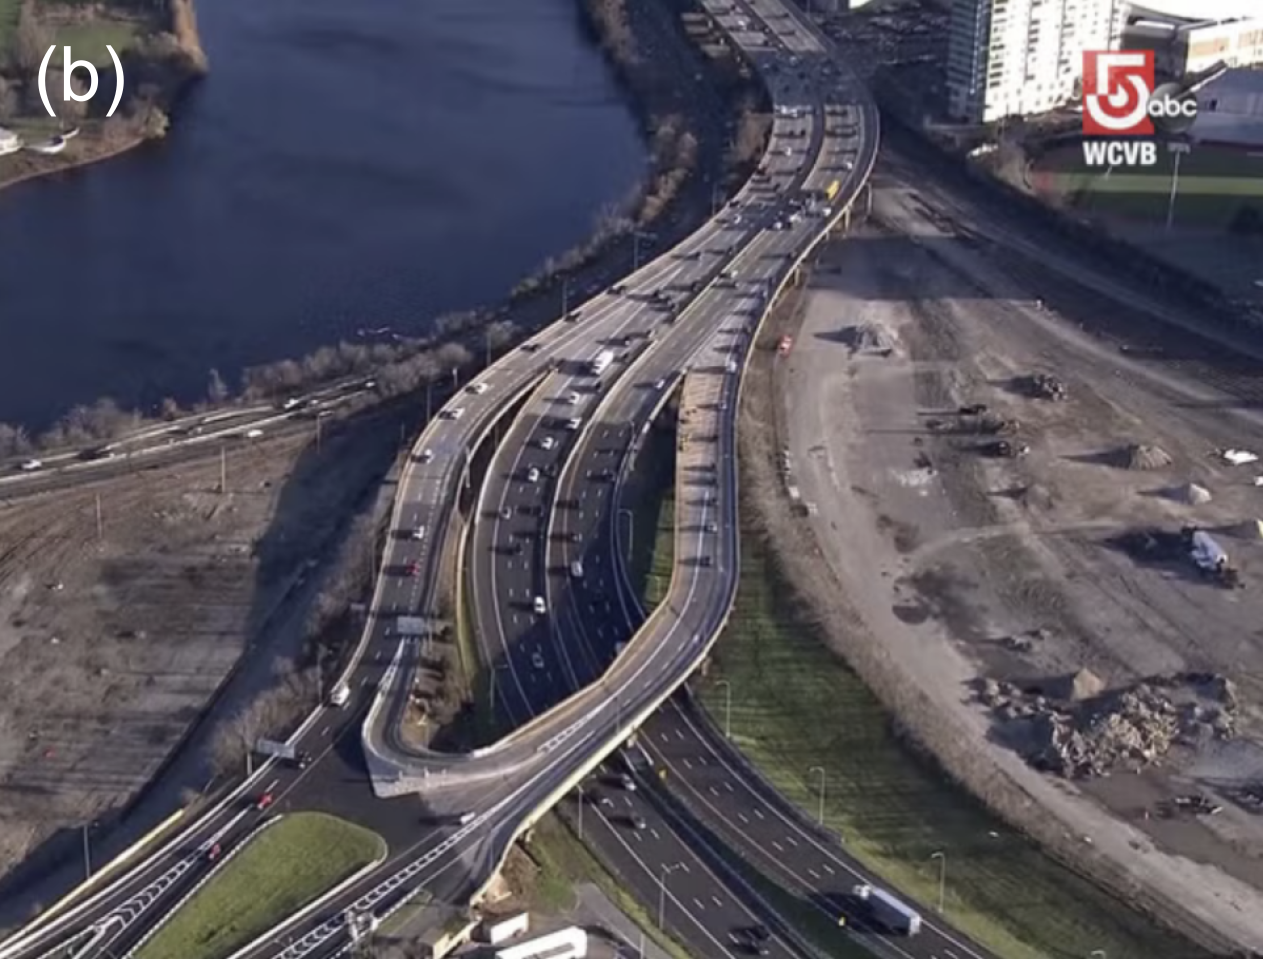
Car-centric infrastructure also leads to huge, convoluted, accident-prone interchanges, as pictured below, making the areas they occupy more dangerous to live in. Car-centrism necessitates car infrastructure that takes up an inordinate amount of space, as cars are inherently less space-efficient than other modes of transportation. Pictured in Figure 3 (a) is the South Bay Interchange here in Boston. You can count roughly 90 cars in the photo. As of 2019, in the US a singular car held on average 1.5 people [16]. From this, we can estimate that 135 people are commuting in that photo alone. That same number of people could instead occupy 7 buses at 50% seat capacity, or just two MBTA Red Line train cars at 40% capacity [17][18]. Roadways are ecological deadzones and only serve cars. The immense space they occupy could be better used or even left alone as greenery. Additionally, having more people driving cars introduces more chances for accidents. This is not just the fault of the drivers. No one is infallible; a driver losing focus for a couple seconds may leave them and others vulnerable to a fatal crash, especially on interstate interchanges pictured below. Urban design should be centered on reducing points of failure and increasing safety and accessibility. Car-centrism does the exact opposite in making drive-commutes more dangerous.
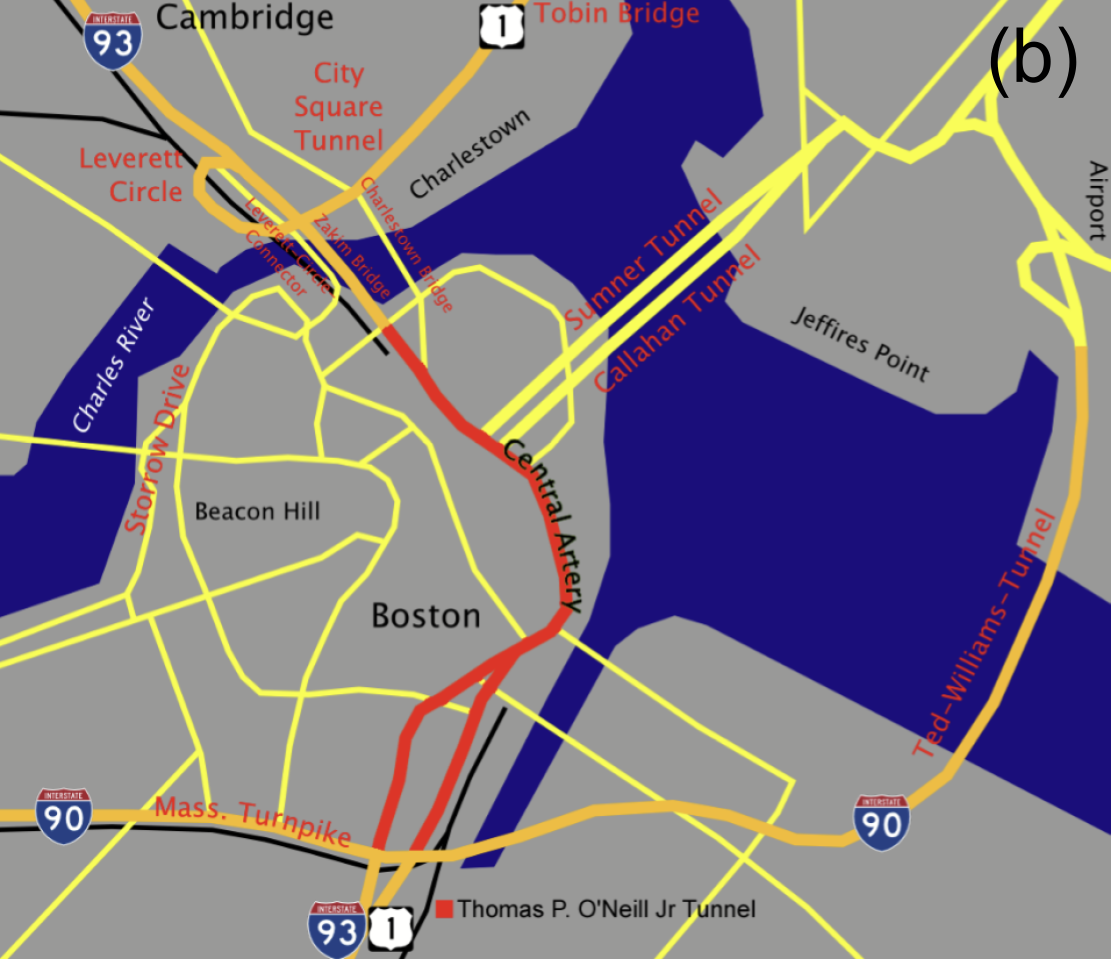
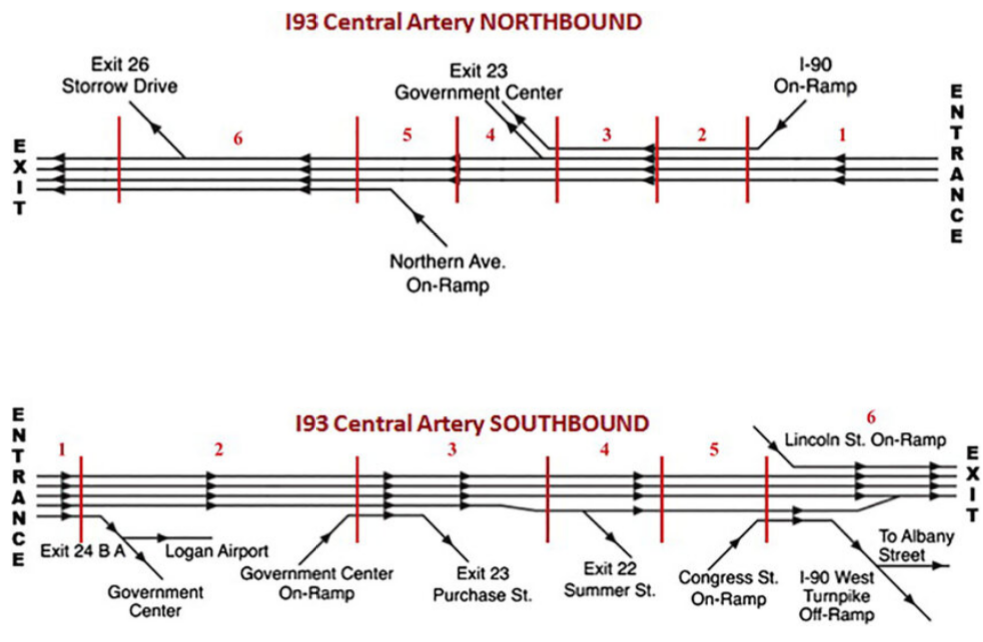
The specifics of the intervention are as follows: the O’Neill tunnel spans eight to ten lanes, which are split for the northbound and southbound sides, as pictured below [19]. The first one to two years will be spent planning the execution of the intervention, as there are a lot of practical and ethical implications involved in this project. The next several years will be spent on the demolition of at minimum two lanes, one each for the northbound and southbound track lines. The rail link will be 2.8 miles channeled underground, so the remaining distance between the stations will need to be dug out. The final couple years will be spent on the construction of the rail link connecting the North and South stations. The hope is that using existing space from I-93 for a significant portion of the line will minimize further displacement of Bostonian residents in the establishment of this link.
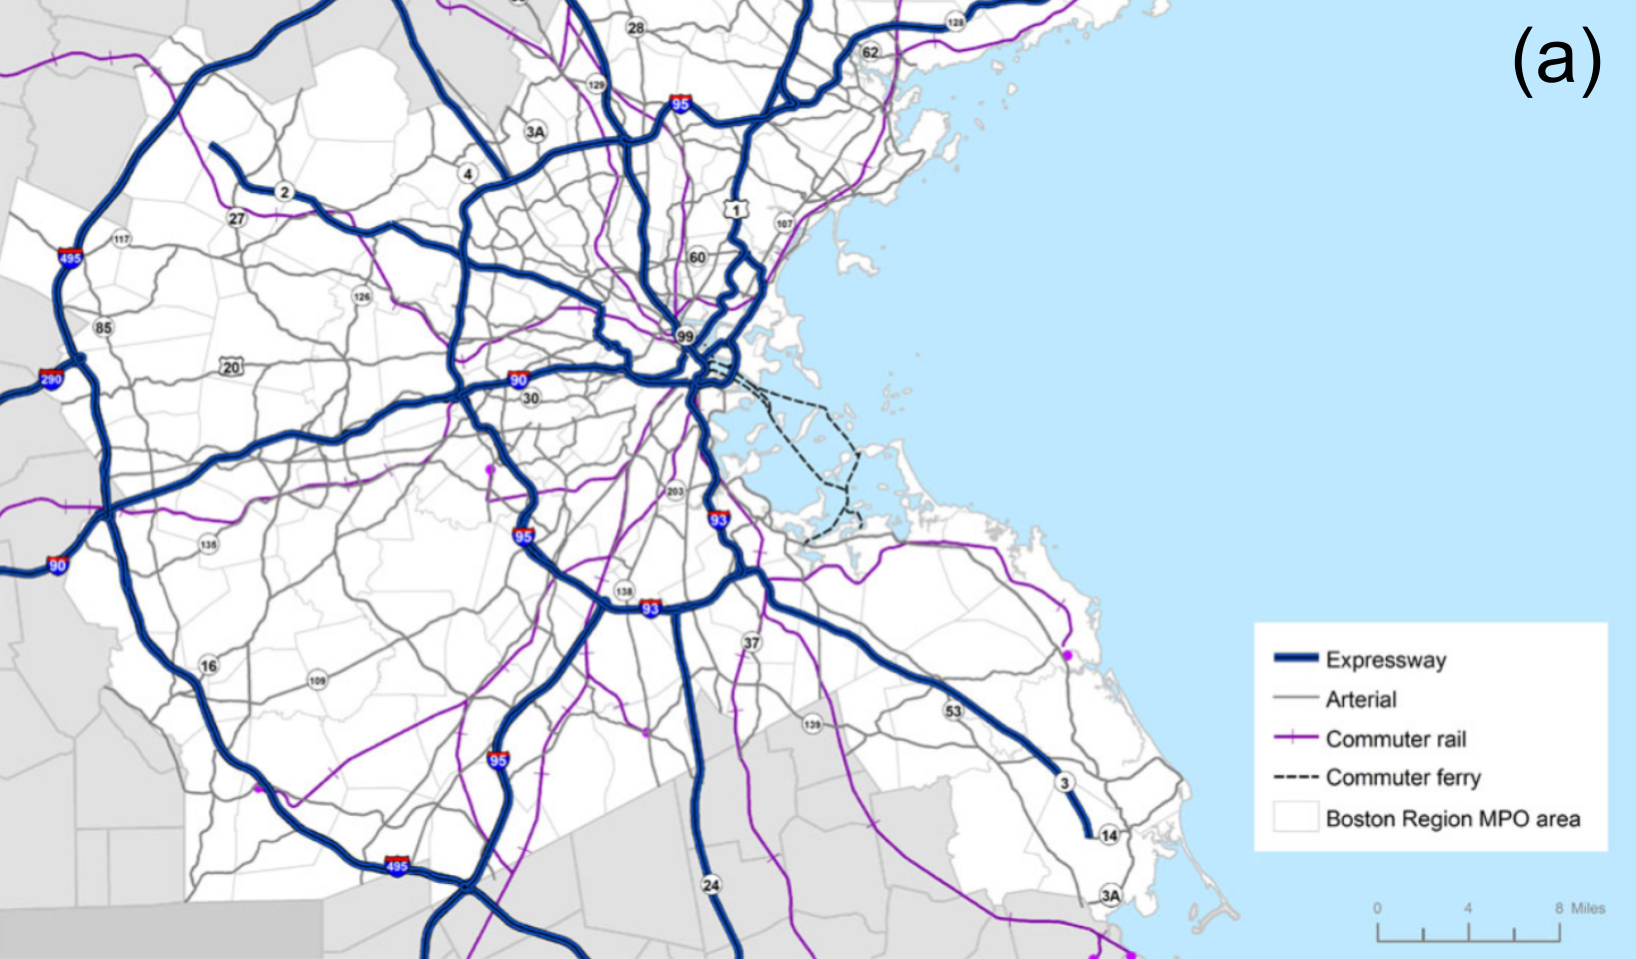
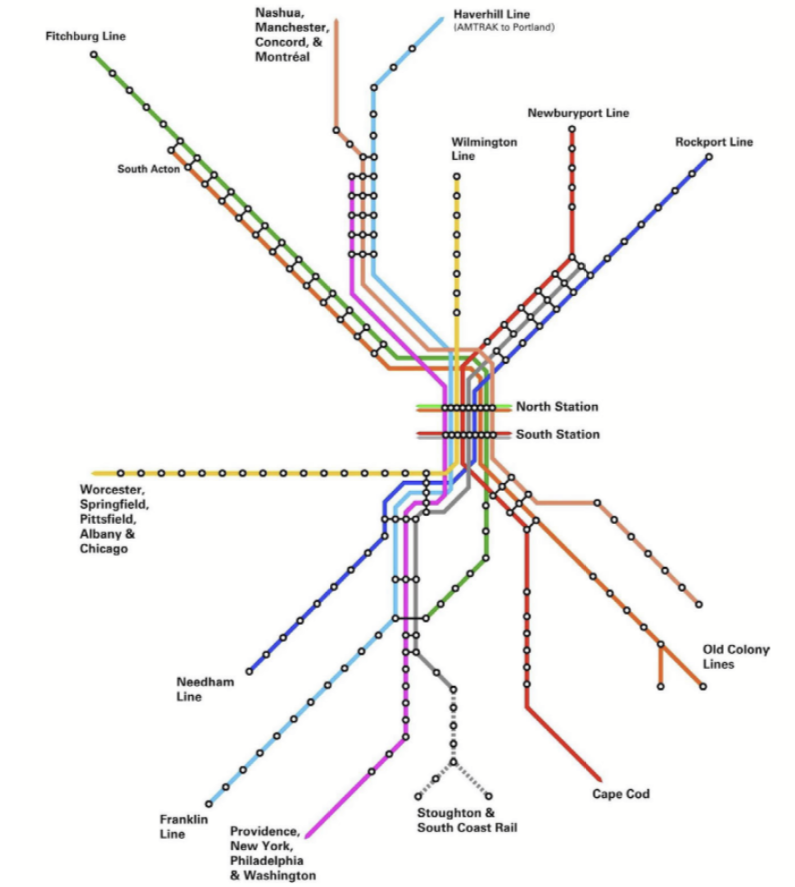
The potential benefits of this intervention are immense. This intervention would shorten the travel time between the stations by 15-25 minutes, saving Bostonians time on their commute. It would create stronger links between Boston and smaller satellite economies like Chelsea, Everett, Lynn, and Salem [20]. Many people would benefit from this. 34% of Bostonians primarily use the MBTA to commute [21]. Among MBTA riders, 65% self-identify as low-income [10]. This means that this intervention will make commuting easier for many Bostonians, while especially benefitting low-income riders. There are already similar, more intensive interventions with very promising insights too. A study published in 2024 examined the potential of adding a North-South Station rail link, as well as some other transit connections, as pictured in figure 5. It found that these MBTA additions could potentially generate $29-31 billion in economic development, quadruple commuter rail ridership, incentivize over 150,000 new housing units, and create new access to 479,000 jobs [22]. These are already great achievements, but in order to also to help the environment, this transit expansion will have to be in conjunction with downsizing the I-93 interstate. This is because, counterintuitively, adding more robust public transportation does not necessarily correlate with lowering demand for cars. This will be discussed further below.
The intervention improves public transportation, which is far more accessible, more energy efficient, and safer than driving. People can find taking public transit over driving more enjoyable since it does not require one’s undivided attention during the entire span of the trip. Many disabled people also benefit from more robust public transportation. Public transit supports climate justice by reducing energy demands and greenhouse gas emissions. Rapid transit, specifically, is roughly 3-4 times more energy efficient than cars, in terms of per-passenger fuel economy [23]. Also, cars are incredibly dangerous, with 40,000 people dying annually in the US due to car collisions, making it one of the leading causes of death for young adults. Pedestrians are disproportionately represented in this figure, too, as they represent 18% of fatalities from car collisions in the US [24][25]. The number of traffic accidents scales with road capacity [26], so lower road capacity would make Boston generally safer, especially for pedestrians.
What about drivers? It is hard to exactly predict how car traffic would evolve with this intervention, but a useful basis is the concept of induced demand. Induced demand describes how counterintuitively, increasing supply actually drives up demand for that commodity. We see how adding more lanes to highways does not improve congestion. In 2009, economists Matthew Turner and Gilles Duranton compared the amount of new roads and highways built in the US between 1980 and 2000 to the total number of miles driven in those cities over the same period. They observed a nearly perfect one-to-one relationship: when road capacity increased by 10%, the amount of driving increased by 10% as well. From this, they proposed the fundamental law of road congestion: new roads will create new drivers, resulting in the intensity of traffic staying the same [27]. Now, why does this happen? Urban planners propose that this has to do with induced demand. When you make driving easier, people will do it more. What about simply adding more public transportation for congestion relief? The data shows that this does not actually work to reduce traffic, as when existing drivers switch over to public transportation, new drivers replace them [28].
In looking through this lens of induced demand, it becomes easier to see why in many instances removing lanes (again, counterintuitively) does not cause a noticeable increase in congestion. Simultaneously, removing lanes can improve the quality of life for many people. We see an example of this in Paris, a city which in recent decades has significantly downsized and reduced its roadways. According to Duranton, driving in Paris was always bad, and with the downsize, it is just as bad, and in particular not worse [28]. Over the past two decades, Paris has seen a 20% increase in public transit usage, presumably from previous drivers switching over.
Let us apply the idea that driving demand scales with road capacity to our intervention. The O’Neill tunnel holds 1.5 miles of roadway, while the total roadway length in Boston is 934 miles [29]. Using this ratio, we can approximate that this intervention scales down roadway capacity by 0.16%. Assuming induced demand, this would mean a reduction of 1200 drivers out of the total 750,000 drive commuters in the Boston Metro [30]. This reveals that this intervention is not very aggressively reducing car-dependency, but will drastically improve the MBTA with the added space for the North-South station rail link. Boston averages 1,900 traffic accidents involving serious injury or death annually [31], so with the reduced roadway capacity of 0.16%, we may observe that roughly three people are saved annually on average. Finally, we may observe a drop in energy demands since rapid transit is 3-4 times more energy efficient than cars on average per capita. Fewer cars will reduce greenhouse gas emissions and lead to less microplastics and other toxic pollutants from car exhaust leaching into the environment, which is better for all life in the vicinity.
Similar interventions in the US are sparse, but relay promise. A notable recent intervention occurred in the city of Rochester, New York. From 2014 to 2017, 22 million was spent to remove portions of the Inner Loop Expressway and convert the space into a ground-level boulevard [32]. This connected communities of color to the city center for the first time since the 1950s. Just $22 million spent on the removal brought $229 million worth of new development, such as commerce, for the city [4]. This suggests that removing portions of highway projects is not only key to reparations for systematic social injustice, but also economically feasible. While it is not true that the only projects worth pursuing have to be profitable, this project pushes back on common narratives that having fewer roads and more rail would be economically disastrous in America.
Although this intervention is quite limited in scope, getting the city of Boston to sign off on this intervention appears inconceivable due to the normalization of car-centricism in America. The Big Oil and Big Automobile (Auto) industries have a vested interest in maintaining the status quo, as they profit from car-dependent urban design. The very notion of “jaywalking” is rooted in Big Auto propaganda. Historically, pedestrians owned the streets. In the 1920s, jaydriving, which predates jaywalking, arose to refer to the reckless driving of early car owners. To bar pedestrians from the streets and enforce car-dependency, automobile companies began aggressively campaigning the idea of jaywalking to shift blame to pedestrians for their own deaths in traffic accidents [33]. The propaganda was so effective that even now, people are far quicker to cast blame on pedestrians for their deaths in traffic accidents than on the drivers who kill them or Big Auto as a whole. This culture of car-dependency also allows Big Auto to establish powerful lobbies to push the government to further cement car-dependency. We see how car-dependency and Big Auto feed each other, at the detriment of the working-class. This can only be stopped through the mobilization of people to intervene.
As discussed before, a significant challenge to this project is overcoming the cultural perception of car-dependency among Bostonians. This is especially true post-COVID, when there is increased stigma towards riding the MBTA, as it is seen as “unclean and crowded” [34]. This can be addressed by practicing grassroots community outreach to inform the public on the true risk factors involved in driving a car versus using public transportation. Also, a significant ethical implication is that although displacement has been minimized since existing lanes will be used in the construction of the North-South station link, displacement may still be inevitable. When planning the line, we must deliberately choose a path that minimizes further displacement and work with local Bostonians living or working on or near the projected path to offset harm done by the inevitable significant land usage for the intervention.
We know that America has the funds and means to carry out this intervention, as observed with the immense amount of federal support and budget overflow that was poured into the Big Dig (the overflow itself was 8.3 times the original budget). Also, as stated earlier, this intervention was originally supposed to happen in the construction of the Big Dig. Time and time again, we see the government abandon the best interests of the people, instead bending to the whims of big corporate interests. At a larger scale, nation-wide movements for the better allocation of the federal budget would be ideal, as the mismanagement of our tax dollars is staggering. For instance, in the year 2026, the government allocates $2.08 trillion for the Department of Defense to carry out atrocities overseas [35]. This is over $2 trillion and just for one year. It would take only $1.4 trillion in total to make American infrastructure safe and dependable, so interventions are affordable with better allocation of the federal budget [4]. On a more approachable scale, organizing for local congestion pricing (for those in high income brackets) could be a step in the right direction for Boston, as it would both disincentivize driving as well as collect funds for potential infrastructure improvements [36].
Finally, I want to address the fact that this intervention is quite constrained in its scope. This smaller scope enabled more reasonable quantification of the intervention’s potential benefits, and more focus on reparations for the segregationist urban planning of the 1950s and beyond.
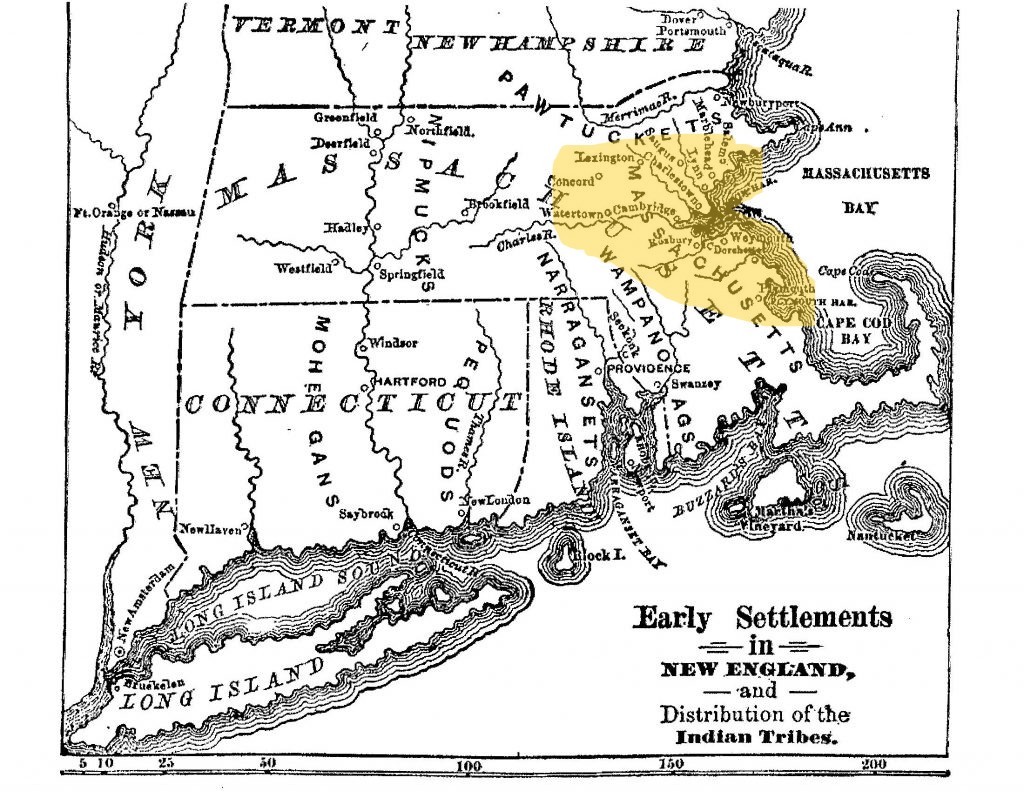
I also want to acknowledge that this intervention involves a significant portion of land of the Massa-adchu-es-et (Massachusett) [37]. This posits a significant moral implication: is this intervention nearly enough? The very existence of Boston is violent in nature, as its establishment is the direct result of the genocide of the Massachusett peoples. One of the indigenous Massachusett tribes was called the Neponset, led in 1620 by Sac’hem Chickataubut, the Principle Chief of the Massachusett. The Neponset lived and thrived in the Neponset band, a region which spanned from Salem to Plymouth along the coast, and inland up to Worcester. For centuries, the Neponset hunted, fished, created tools, sculpted weapons, planted vast crops, and stored and processed harvests. They celebrated, practiced their religion, built homes, raised families, and enjoyed prosperity [38].
The arrival of the English brought forth trade and, because of the deliberate malice of the evil European visitors, the 1630s smallpox pandemic of the Neponset. The English created the pandemic by giving infected blankets to the Neponset people, using the pandemic as a tool of genocide and settler-colonization [38], in order to the forcefully displace the Neponsets to Ponkapoag, a subset of the Neponset territory. English Evangelist John Elliot established the Ponkapoag territory as a “Praying Indian Town,” where he assimilated the Massachusett to Christianity and Puritan culture. He separated those residing in Ponkapoag from their unconverted “savage” counterparts. The Massachusett people still live on, with the existence of the Massachusett-Ponkapoag Tribal Council [38]. We see that the Massachusett have a vast history of prosperity long before the English invasion, as well as immense painful history due to past and continued erasure and genocide today. I position my intervention as a step in the right direction, but not necessarily nearly enough. Far more radical change, involving land back, is necessary to have true justice for what happened to the Massachusett, and for all other indigenous nations on Turtle Island.
Additionally, rail has historically been Wiindigo infrastructure: used as an effective tool of settler-colonization and genocide against indigenous peoples across the US [39]. I only hope that with this intervention, Boston can use the positive qualities of having more rail in tandem with fewer cars—increased accessibility, energy efficiency, and safety—to improve the material living conditions of many Bostonians. The implementation of this design intervention must be carefully done to prevent contributing to the same cycles of genocidal violence that rail has historically exacerbated. This can only be done by centering marginalized identities, and especially the Massachusett, in the design choices for this intervention, as they are the ones disproportionately harmed by infrastructure injustice. Only then can we have truly just infrastructure.
Sources
[1] “The CMP Network,” CMP Report - Chapter 2 [Online]. Available: https://www.ctps.org/data/html/programs/cmp/Report/CMP_Report_Ch_2_The_CMP_Network.html. [Accessed: 06-May-2026].
[2] “Thomas P. O’Neill Jr. tunnel,” Academic Dictionaries and Encyclopedias [Online]. Available: https://en-academic.com/dic.nsf/enwiki/2949579. [Accessed: 06-May-2026].
[3] Russo, K., Julius, J., lhem, W., 2025, In the Spirit of Right and Respectful Relations. Se’Si’Le’ with Braided River.
[4] 2024, “It’s time to address our segregationist Urban Highways,” Columbia University Mailman School of Public Health [Online]. Available: https://www.publichealth.columbia.edu/news/its-time-address-our-segregationist-urban-highways. [Accessed: 06-May-2026].
[5] “The central artery,” SEGREGATION BY DESIGN [Online]. Available: https://www.segregationbydesign.com/boston/the-central-artery. [Accessed: 06-May-2026].
[6] “The big dig: Project background,” Mass.gov [Online]. Available: https://www.mass.gov/info-details/the-big-dig-project-background. [Accessed: 06-May-2026].
[7] “On Dec. 31, It's Official: Boston's Big Dig Will Be Done.” Washington Post [Online]. Available: https://www.washingtonpost.com/wp-dyn/content/article/2007/12/25/AR200712250 0600.html [Accessed: 06-May-2026].
[8] 2012, “Boston traffic: Before and after the big dig,” WBUR News [Online]. Available: https://www.wbur.org/news/2012/07/12/big-dig-effect. [Accessed: 06-May-2026].
[9] Inrix, 2026, “Congestion costs each American nearly 100 hours, $1,400 a year,” INRIX [Online]. Available: https://inrix.com/press-releases/2019-traffic-scorecard-us/. [Accessed: 06-May-2026].
[10] MBTA rider census [Online]. Available: https://www.mbta.com/performance-metrics/the-rider-census. [Accessed: 06-May-2026].
[11] Sweeney, E., 2025, “Officials issue annual warning about ‘storrowing’ - The Boston Globe,” BostonGlobe.com [Online]. Available: https://www.bostonglobe.com/2025/08/26/metro/new-video-warns-drivers-storrowing/. [Accessed: 06-May-2026].
[12] “Massachusetts Clean Energy and Climate Metrics,” Mass.gov [Online]. Available: https://www.mass.gov/info-details/massachusetts-clean-energy-and-climate-metrics. [Accessed: 06-May-2026].
[13] 2025, “Vehicular emissions cause 342 premature deaths each year in Greater Boston,” Vehicular Emissions Cause 342 Premature Deaths Each Year in Greater Boston | SPH [Online]. Available: https://www.bu.edu/sph/news/articles/2025/vehicular-emissions-cause-342-premature-deaths-each-year-in-greater-boston/. [Accessed: 06-May-2026].
[14] Most of the microplastics in urban air come from tires [Online]. Available: https://www.forbes.com/sites/lauriewinkless/2026/04/12/most-of-the-microplastics-in-urban-air-come-from-tires/. [Accessed: 06-May-2026].
[15] Gaton, B., 2024, “Are EVs really much heavier than their ice equivalents?,” The Driven [Online]. Available: https://thedriven.io/2024/05/03/are-evs-really-much-heavier-than-their-ice-equivalents/. [Accessed: 06-May-2026].
[16] 2025, “Personal Transportation Factsheet,” University of Michigan Center for Sustainable Systems. Pub. No. CSS01-07.
[17] “Crowding Information for Riders,” Massachusetts Bay Transportation Authority [Online]. Available: https://www.mbta.com/projects/crowding-information-riders. [Accessed: 21-May-2026].
[18] Kaiser, H., 2015, “Introduction to MBTA Red Line Capacity,” Massachusetts Bay Transportation Authority. June 2015 Edition.
[19] Perkins, J. L., Padró-Martínez, L. T., and Durant, J. L., 2013, “Particle number emission factors for an urban highway tunnel,” Atmospheric Environment, 74, pp. 326–337.
[20] Bohl, C., 2024, “Will Boston ever build the North-South Rail Link?,” BostonGlobe.com [Online]. Available: https://www.boston.com/news/wickedpedia/2024/03/19/will-boston-ever-build-the-north-south-rail-link/. [Accessed: 20-May-2026].
[21] Marcarelli, R., 2016, “Is the MBTA really a top transit system in the U.S.?,” Boston, MA Patch [Online]. Available: https://patch.com/massachusetts/boston/mbta-3rd-best-transit-system-us-0. [Accessed: 06-May-2026].
[22] 2024, “Moulton backs north-south rail link, touts housing boost,” Boston.com [Online]. Available: https://www.boston.com/real-estate/real-estate-news/2024/10/30/moulton-backs-north-south-rail-link-touts-housing-boost/. [Accessed: 06-May-2026].
[23] 2022, “Average Per-Passenger Fuel Economy by Travel Mode,” Oak Ridge National Laboratory, Transportation Energy Data Book 40. 2022, Table 2.13. Available: https://afdc.energy.gov/data/10311. [Accessed: 06-May-2026].
[24] Naumann, R. B., West, B. A., Barry, V., Matthews, S., and Lee, R., 2025, “Pedestrian and overall road traffic crash deaths — United States and 27 other high-income countries, 2013–2022,” MMWR. Morbidity and Mortality Weekly Report, 74(8), pp. 134–139.
[25] Bieber, C., 2024, “Car Accident Statistics,” Forbes [Online]. Available: https://www.forbes.com/advisor/legal/auto-accident/car-accident-statistics/#fatal_car_accident_statistics_section. [Accessed: 21-May-2026].
[26] Historical car crash deaths and rates - injury facts [Online]. Available: https://injuryfacts.nsc.org/motor-vehicle/historical-fatality-trends/deaths-and-rates/. [Accessed: 06-May-2026].
[27] Duranton, G., and Turner, M., 2009, The Fundamental Law of road congestion: Evidence from US cities.
[28] Mann, A., 2014, “What’s up with that: Building bigger roads actually makes traffic worse,” Wired [Online]. Available: https://www.wired.com/2014/06/wuwt-traffic-induced-demand/. [Accessed: 06-May-2026].
[29] “Socioeconomic Road Miles,” Road miles [Online]. Available: https://dls-gw.dor.state.ma.us/reports/rdpage.aspx?rdreport=socioeconomic.roadmiles. [Accessed: 06-May-2026].
[30] Tran, S., 2023, “Inside Boston’s changing commute: How traffic’s changed at Rush hour and more,” NBC Boston [Online]. Available: https://www.nbcboston.com/news/local/inside-bostons-changing-commute/2956180/. [Accessed: 06-May-2026].
[31] 2025, “Boston-Area Car Accident Statistics and Safety Trends (2025 update),” Kiley Law Group Personal Injury Lawyers [Online]. Available: https://tomkileylaw.com/boston-area-car-accident-statistics/. [Accessed: 06-May-2026].
[32] “Project profile: Rochester Inner Loop East, New York, a freeway to Boulevard,” FHWA [Online]. Available: https://www.fhwa.dot.gov/ipd/project_profiles/ny_freeway_to_boulvard_rochester.aspx. [Accessed: 06-May-2026].
[33] 2022, “The Invention of Jaywalking,” NEC [Online]. Available: https://www.yournec.org/the-invention-of-jaywalking/. [Accessed: 06-May-2026].
[34] Basu, R., and Ferreira, J., 2021, “Sustainable mobility in auto-dominated Metro Boston: Challenges and opportunities post-COVID-19,” Transport Policy, 103, pp. 197–210.
[35] USAspending.gov [Online]. Available: https://www.usaspending.gov/agency/department-of-defense?fy=2026. [Accessed: 06-May-2026].
[36] 2024, “Could Boston be the next city to impose congestion pricing?,” Boston University [Online]. Available: https://www.bu.edu/articles/2024/boston-congestion-pricing/. [Accessed: 06-May-2026].
[37] “Our home on Native Land,” Native [Online]. Available: https://native-land.ca/. [Accessed: 06-May-2026].
[38] The Massachusett tribe at Ponkapoag [Online]. Available: https://massachusetttribe.org/. [Accessed: 06-May-2026].
[39] Laduke, W., Cowen, D., 2020. Beyond Wiindigo Infrastructure. Durham: Duke University Press.
See more
- Previous: Some Spectacular Birding
